Graphs of Trigonometric Functions
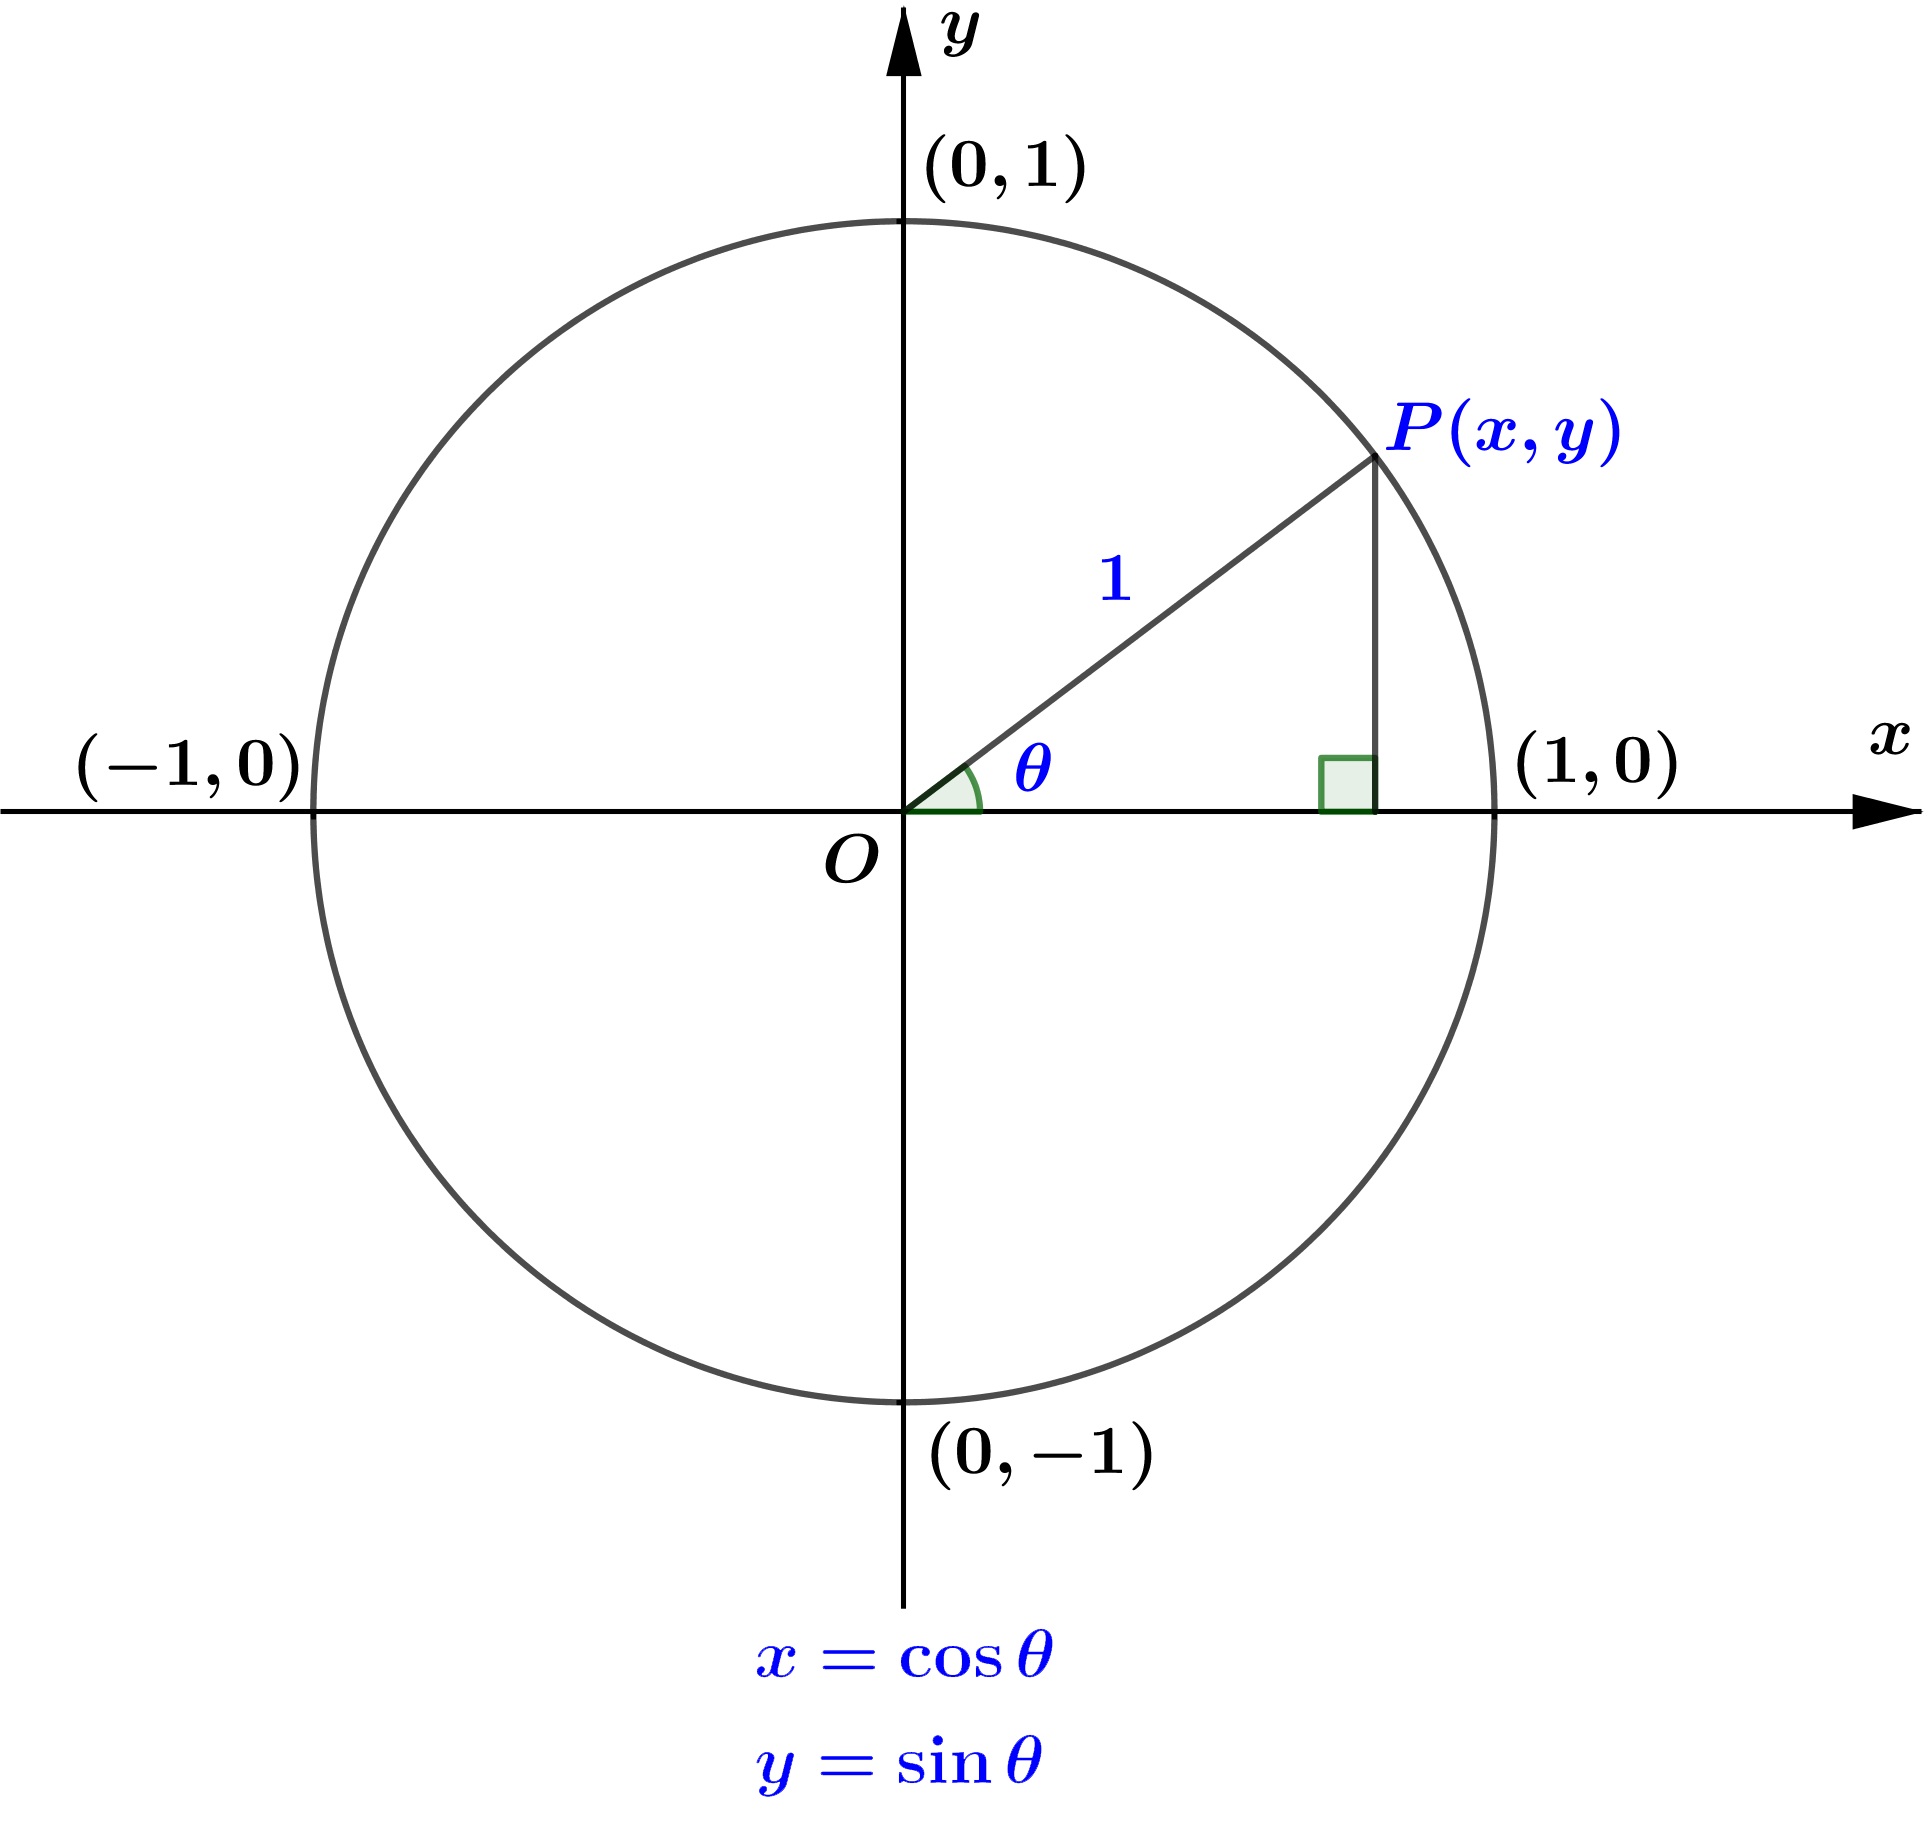
OP နှင့် positive x-axis ကြားရှိထောင့် (θ) cosine ratio (cosθ) သည် OP နှင့် unit circle ဖြတ်သွားသော
အမှတ် P(x,y) ၏ x-coordinate တန်ဖိုးဖြစ်ပြီး sine ratio (sinθ) သည် y-coordinate တန်ဖိုးဖြစ်ကြောင်း
သိရှိခဲ့ပြီး ဖြစ်သည်။
အဆိုပါ sinθ နှင့် cosθ သည် θ ပေါ်မူတည်၍ပြောင်းလဲနေမည် ဖြစ်သည်ကို unit circle တွင် အလွယ်တကူ သိရှိနိုင်သည်။ OP တစ်ပတ်လှည့်ပတ်ခြင်း 0∘≤θ≤360∘ တွင် sinθ နှင့် cosθ သည် θ ပေါ်မူတည်၍ပြောင်းလဲ နေသော်လည်း တစ်ပတ်ပြည့်ပြီးနောက် နောက်တွင် မူလတစ်ပတ်က တန်ဖိုးများကိုသာ ပြန်လည်ရောက်ရှိလာမည် ဖြစ်သည်။ ထို့သို့ တစ်ပတ်ပြည့်တိုင်း တန်ဖိုးတူနေရာများသို့ ပြန်လည်ရောက်ရှိလာသော sinθ နှင့် cosθ တို့ကို periodic function များဟုခေါပြီး မတူညီသော တန်ဖိုးများ ရရှိစေသည့် တစ်ပတ် 360∘or 2π ကို sinθ နှင့် cosθ တို့၏ period ဟုခေါ်သည်။
unit circle ၏ အဝန်းပိုင်းကို (1,0) နေရာမှ ဖြတ်တောက်၍ အဖြောင့်အတိုင်းထားလိုက်သည်ဟု ယူဆမည်။ အဝန်းပိုင်းပေါ်ရှိ θ ၏ တန်ဖိုးနှင့် သက်ဆိုင်ရာ Trigonometric function value ၏ တန်ဖိုးများကို နှိုင်းယှဉ်ဖော်ပြခြင်းဖြင့် သတ်မှတ်ထာသော Trigonometric Function ၏ graph ကို ရရှိမည်ဖြစ်သည်။ အောက်ပါ applet တွင် trigonometric function တစ်ခုချင်းစီ၏ 0≤θ≤2π အတွင်း ရရှိလာမည့် trigonometric graph တစ်ခုစီကို လေ့လာနိုင်ပါသည်။
The Graph of y=sinθ
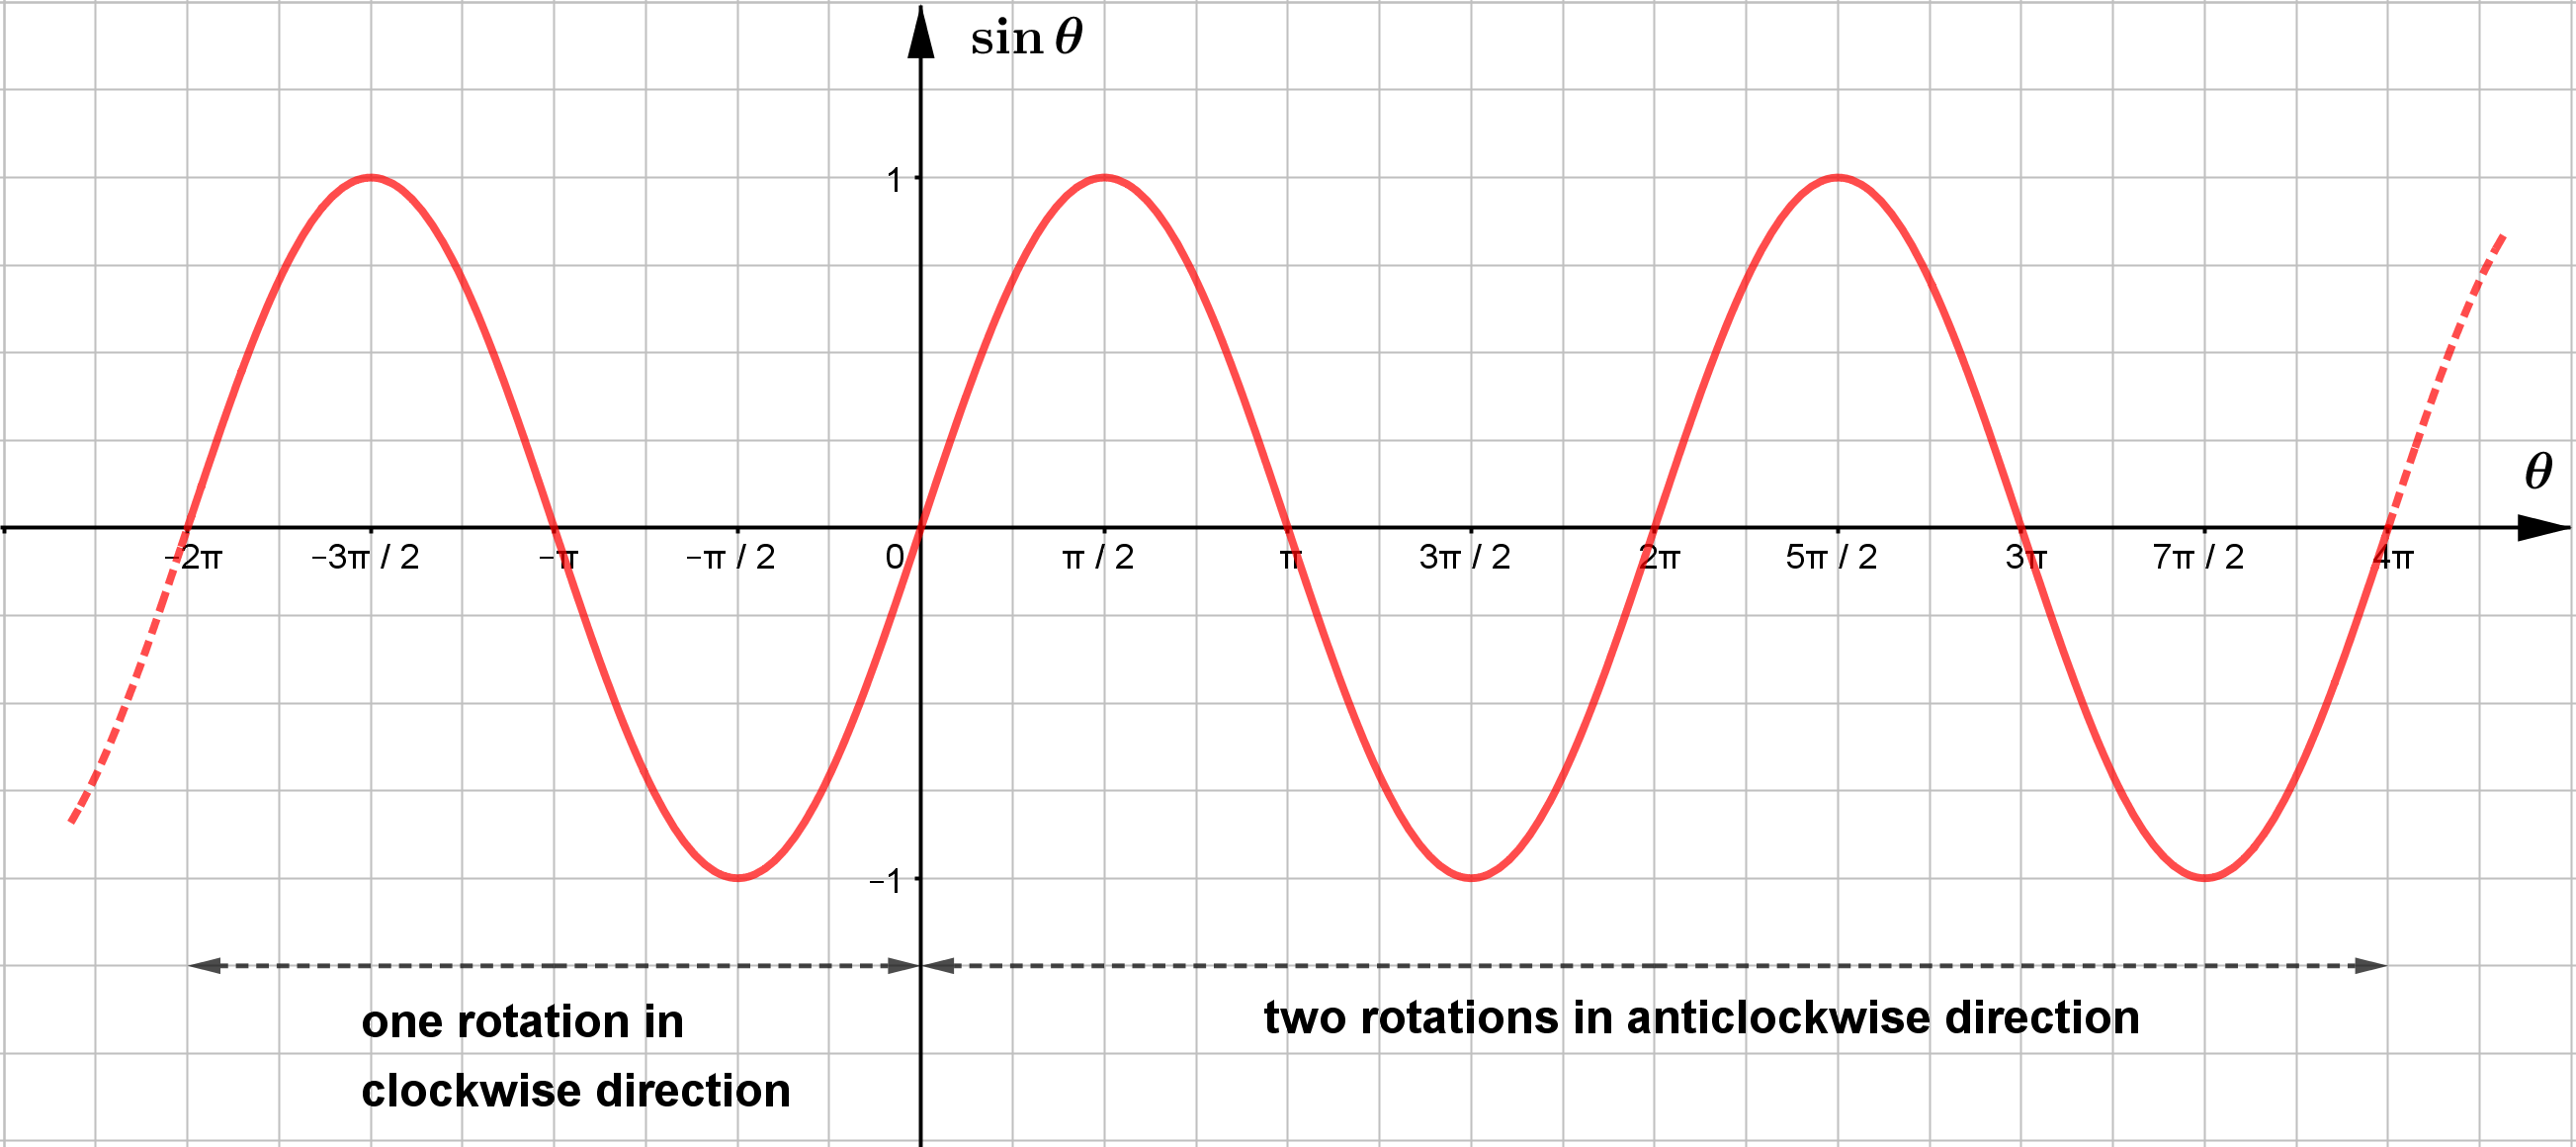
terminal side ကို aticlockwise direction ဖြင့် လှည့်သည့်အခါ sinθ ၏ graph သည် positive x-axis
ဘက်တွက် တစ်ပတ်ပြည့်တိုင်း wave တစ်ခု ဖြစ်လာပြီး clockwise direction ဖြင့် လှည့်သည့်အခါ sinθ ၏ graph
သည် negative x-axis ဘက်တွက် တစ်ပတ်ပြည့်တိုင်း wave တစ်ခု ဖြစ်လာမည်ဖြစ်သည်။ ထို့ကြောင့် y=sinθ ၏
graph ကို sine wave (သို့) sinusoidal wave ဟုလည်းခေါ်သည်။ sine wave တစ်ခု ဖြစ်ရန်လိုအပ်သော θ တန်ဖိုးကို
period ဟုခေါ်သည်။ ထို့ကြောင့် y=sinθ ၏ period သည် 360∘or 2π ဖြစ်သည်။
y=sinθ ၏ maximum value သည် 1 ဖြစ်ပြီး minimum value သည် −1 ဖြစ်သည်။ ထို့ကြောင့် မည်သည့် θ တန်ဖိုးအတွက် မဆို −1≤sinθ≤1 ဖြစ်သည်။ အဆိုပါကြားပိုင်းကို sine function ၏ range ဟု ခေါ်သည်။ y=sinθ သည် wave ရွေ့လျားရာမျဉ်း (line of propagation) မှ အမြင့်ဆုံးအမှတ်ထိ 1 unit ရှိပြီး အနိမ့်ဆုံးအမှတ်သို့လည်း 1 unit ရှိသည်။ ထို့သို့ line of propagation မှ အမြင့်ဆုံးအမှတ် (သို့မဟုတ်) line of propagation မှ အနိမ့်ဆုံးအမှတ် သို့ အကွာအဝေးကို amplitude ဟုခေါ်သည်။ အခြားတစ်နည်းဆိုရသော် အမြင့်ဆုံးအမှတ် နှင့် အနိမ့်ဆုံးအမှတ် နှစ်ခုကြား အကွာအဝေး၏ တစ်ဝက်ကို amplidude ဟု ခေါ်နိုင်သည်။
The Graph of y=asinθ
y=sinθ တွင် −1≤sinθ≤1 ဖြစ်သောကြောင့် y=asinθ
တွင် −a≤asinθ≤a ဖြစ်မည်။ ထို့ကြောင့် ...
ဟုမှတ်သားနိုင်သည်။
ထို့ကြောင့် ...
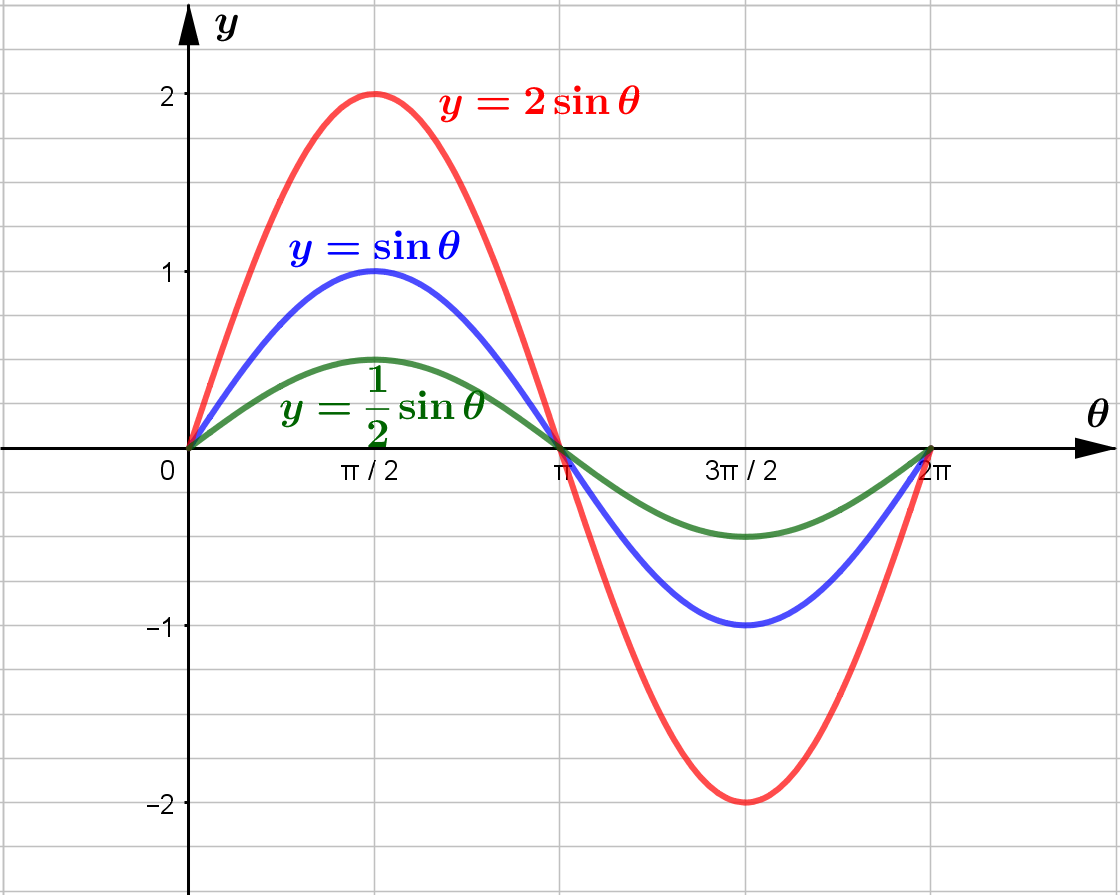
y=sinθ⇒ amplitude =1
y=2sinθ⇒ amplitude =2
y=12sinθ⇒ amplitude =12
Grade 11 တွင် လေ့လာခဲ့ပြီးဖြစ်သော Trasformation ရှုထောင့်မှကြည့်လျှင် y=asinθ သည် y=sinθ ကို vertical scaling ပြုလုပ်လိုက်ခြင်း ဖြစ်ပြီး scale factor =a ဖြစ်သည်ဟု မှတ်သားနိုင်သည်။ ထို့ကြောင့် y=sinθ ကို vertical scaling ပြုလုပ်လျှင် scale factor သည် amplitude ဖြစ်သည်။
The Graph of y=sin(b⋅θ)
ဆက်လက်၍ အောက်ပါ diagram ကို လေ့လာကြည့်ပါ။
period of y=sinθ⇒2π
y=sin2θ သည် y=sinθ ကို horizontal scaling ပြုလုပ်လိုက်ခြင်း ဖြစ်ပြီး scale factor မှာ
12 ဖြစ်သည်။ y=sin2θ ၏ period (the value of θ to form one complete cycle)
မှာ π ဖြစ်သည်ကို တွေ့ရမည်။
အလားတူပင် y=sin12θ သည် y=sinθ ကို horizontal scaling ပြုလုပ်လိုက်ခြင်း ဖြစ်ပြီး
scale factor မှာ 2 ဖြစ်သည်။ y=sin12θ ၏ period မှာ 4π ဖြစ်သည်။
ထို့ကြောင့် y=sinθ ကို horizontal scaling ပြုလုပ်လိုက်ခြင်းဖြင့် period ကို အပြောင်းအလဲ ဖြစ်စေပြီး ပြောင်းလဲသွားသော period တန်ဖိုးမှာ scale factor ×2π ဖြစ်သည်ကို တွေ့ရမည်။ အောက်ပါအတိုင်း ယျေဘုယျ မှတ်သားနိုင်ပါသည်။
The Graph of y=asin(b⋅θ+c)+d
Grade 11 တွင် လေ့လာခဲ့ပြီးဖြစ်သော Function Transformation ၏ rule များအတိုင်း y=asin(b⋅θ+c)+d တွင် c သည် y=sinθ ကို horizontal translation ပြုလုပ်ပေးခြင်း ဖြစ်ပြီး d သည် y=sinθ ကို vertical translation ပြုလုပ်ပေးခြင်း ဖြစ်သည်ဟု သိရှိရမည် ဖြစ်သည်။
ဥပမာ အနေဖြင့် y=sinθ နှင့် y=32sin(2θ−π3) တို့ကို
နှိုင်းယှဉ်လေ့လာကြည့်ပါမည်။
For y=sinθ,
period = 2π
amplitude = 1
x0π2π3π22πy010−10
For y=32sin(2θ−π3),
period = 12×2π=π
amplitude = 32
Let f(θ)=sinθ then y=32sin(2θ−π3)=32f(2θ−π3).
အထက်ပါ ဇယားတွင် ဖော်ပြထားသော y=sinθ ပေါ်တွင်ရှိသော အမှတ်များ ၏
y=32sin(2θ−π3) ပေါ်တွင်ရှိသော mapped point များကို
transformation method ဖြင့်ရှာကြည့်ပါမည်။
(0,0)f(θ−π3)→(π3,0)f(2θ−π3)→(π6,0)32f(2θ−π3)→(π6,0)
(π2,1)f(θ−π3)→(5π6,1)f(2θ−π3)→(5π12,1)32f(2θ−π3)→(5π12,32)
(π,0)f(θ−π3)→(4π3,0)f(2θ−π3)→(2π3,0)32f(2θ−π3)→(2π3,0)
(3π2,−1)f(θ−π3)→(11π6,−1)f(2θ−π3)→(11π12,−1)32f(2θ−π3)→(11π12,−32)
(2π,0)f(θ−π3)→(7π3,0)f(2θ−π3)→(7π6,0)32f(2θ−π3)→(7π6,0)
ထို့ကြောင့် y=sinθ နှင့် y=32sin(2θ−π3) တို့၏
graph နှစ်ခုကို sketch လုပ်နိုင်ပြီဖြစ်ရာ အောက်ပါအတိုင်း ရရှိမည်ဖြစ်သည်။
The Graph of y=cosθ
y=cosθ ၏ graph သည် လည်း sine wave ကဲ့သို့ပင် one complete cycle ဖြစ်ရန် θ=360∘=2π ဖြစ်သည်။ ထို့ကြောင့် y=cosθ ၏ period မှာ 2π ဖြစ်မည်။ y=sinθ ကဲ့သို့ပင် y=cosθ ၏ range သည်လည်း −1≤cosθ≤1 ဖြစ်ရာ amplitude မှာ 1 iunit ဖြစ်သည်။
sin(π2−θ=cosθ) ဟု သိရှိခဲ့ပြီးဖြစ်သည်။
y=cosθ သည် y=sinθ ကို horizontal translation ပြုလုပ်ထားခြင်းပင်ဖြစ်သည်။
ထို့ကြောင့် y=cosθ သည် y=sinθ ၏ ဂုဏ်သတ္တိများနှင့် တူညီသည်။
sine function နှင့်
cosine function များ၏ ဂုဏ်သတ္တိများကို အောက်ပါ အတိုင်းအချုပ်မှတ်နိုင်သည်။
| Functions | Amplitude | Period | Range |
| y=sinθ | 1 | 2π | −1≤sinθ≤1 |
| y=a(b⋅sinθ+c)+d | a | 2πb | −a+d≤a(b⋅sinθ+c)+d≤a+d |
| y=cosθ | 1 | 2π | −1≤sinθ≤1 |
| y=a(b⋅cosθ+c)+d | a | 2πb | −a+d≤a(b⋅cosθ+c)+d≤a+d |
Question 1
The diagram shows part of the curve with equation
y=psin(qθ)+r, where p,q and r are constants.
(a) State the value of p.
(b) State the value of q.
(c) State the value of r.
Question 2
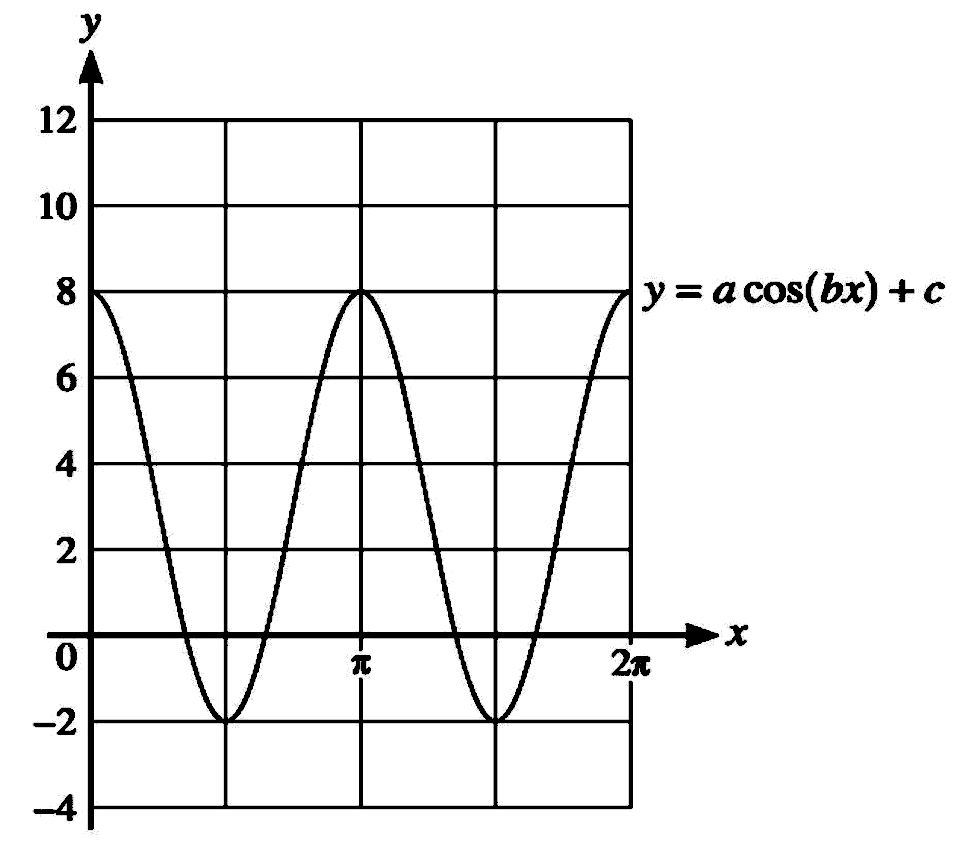
The diagram shows part of the graph of y=a \cos (b x)+c.
(a) Find the values of the positive integers a, b and c.
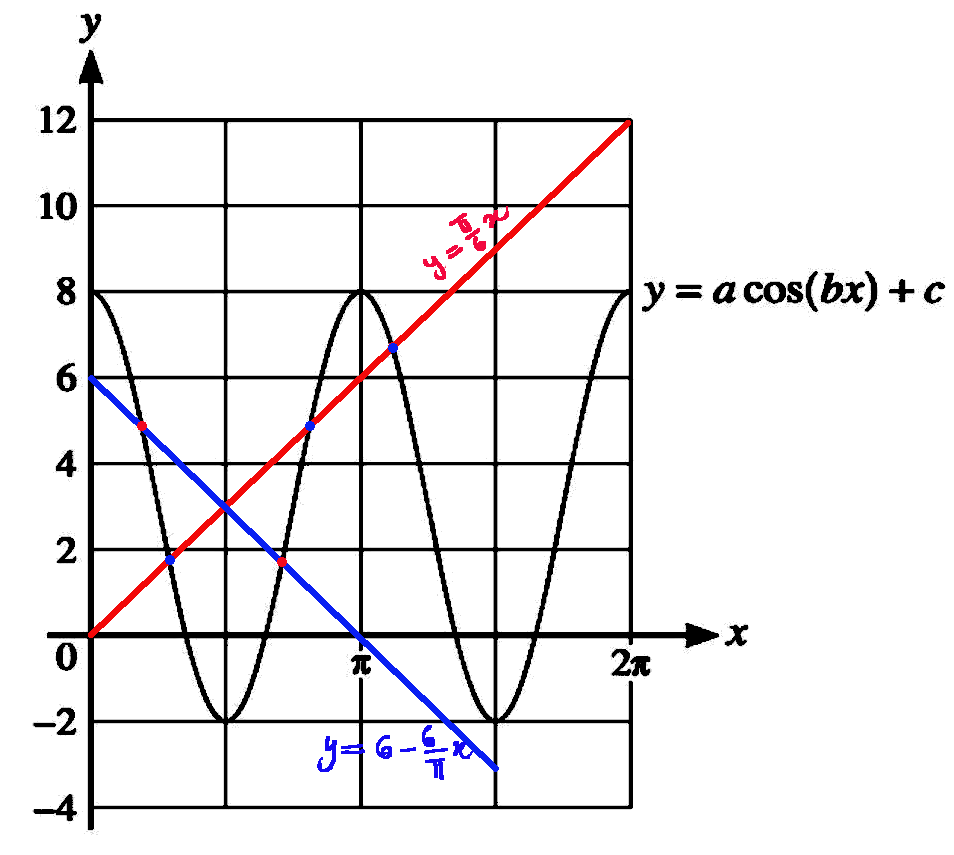
(b) For these values of a, b and c, use the given diagram to determine
the number of solutions in the interval 0 \leqslant x \leqslant 2 \pi for
each of the following equations.
(i) \displaystyle a \cos (b x)+c=\frac{6}{\pi} x
(ii) \displaystyle a \cos (b x)+c=6-\frac{6}{\pi} x.
 For the graph
 Question 3
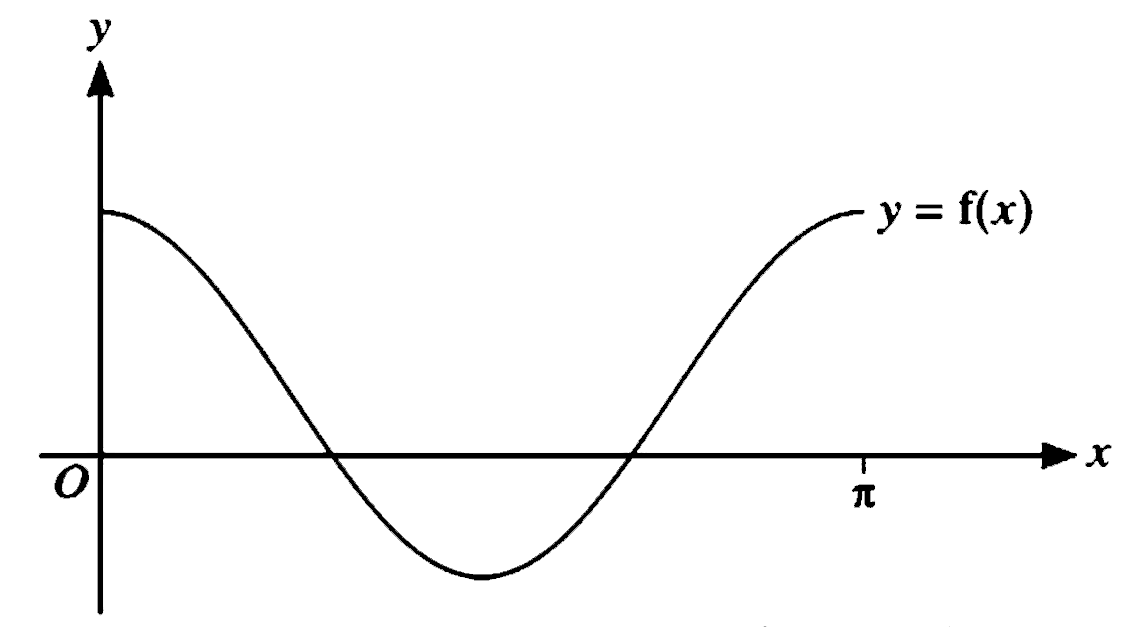
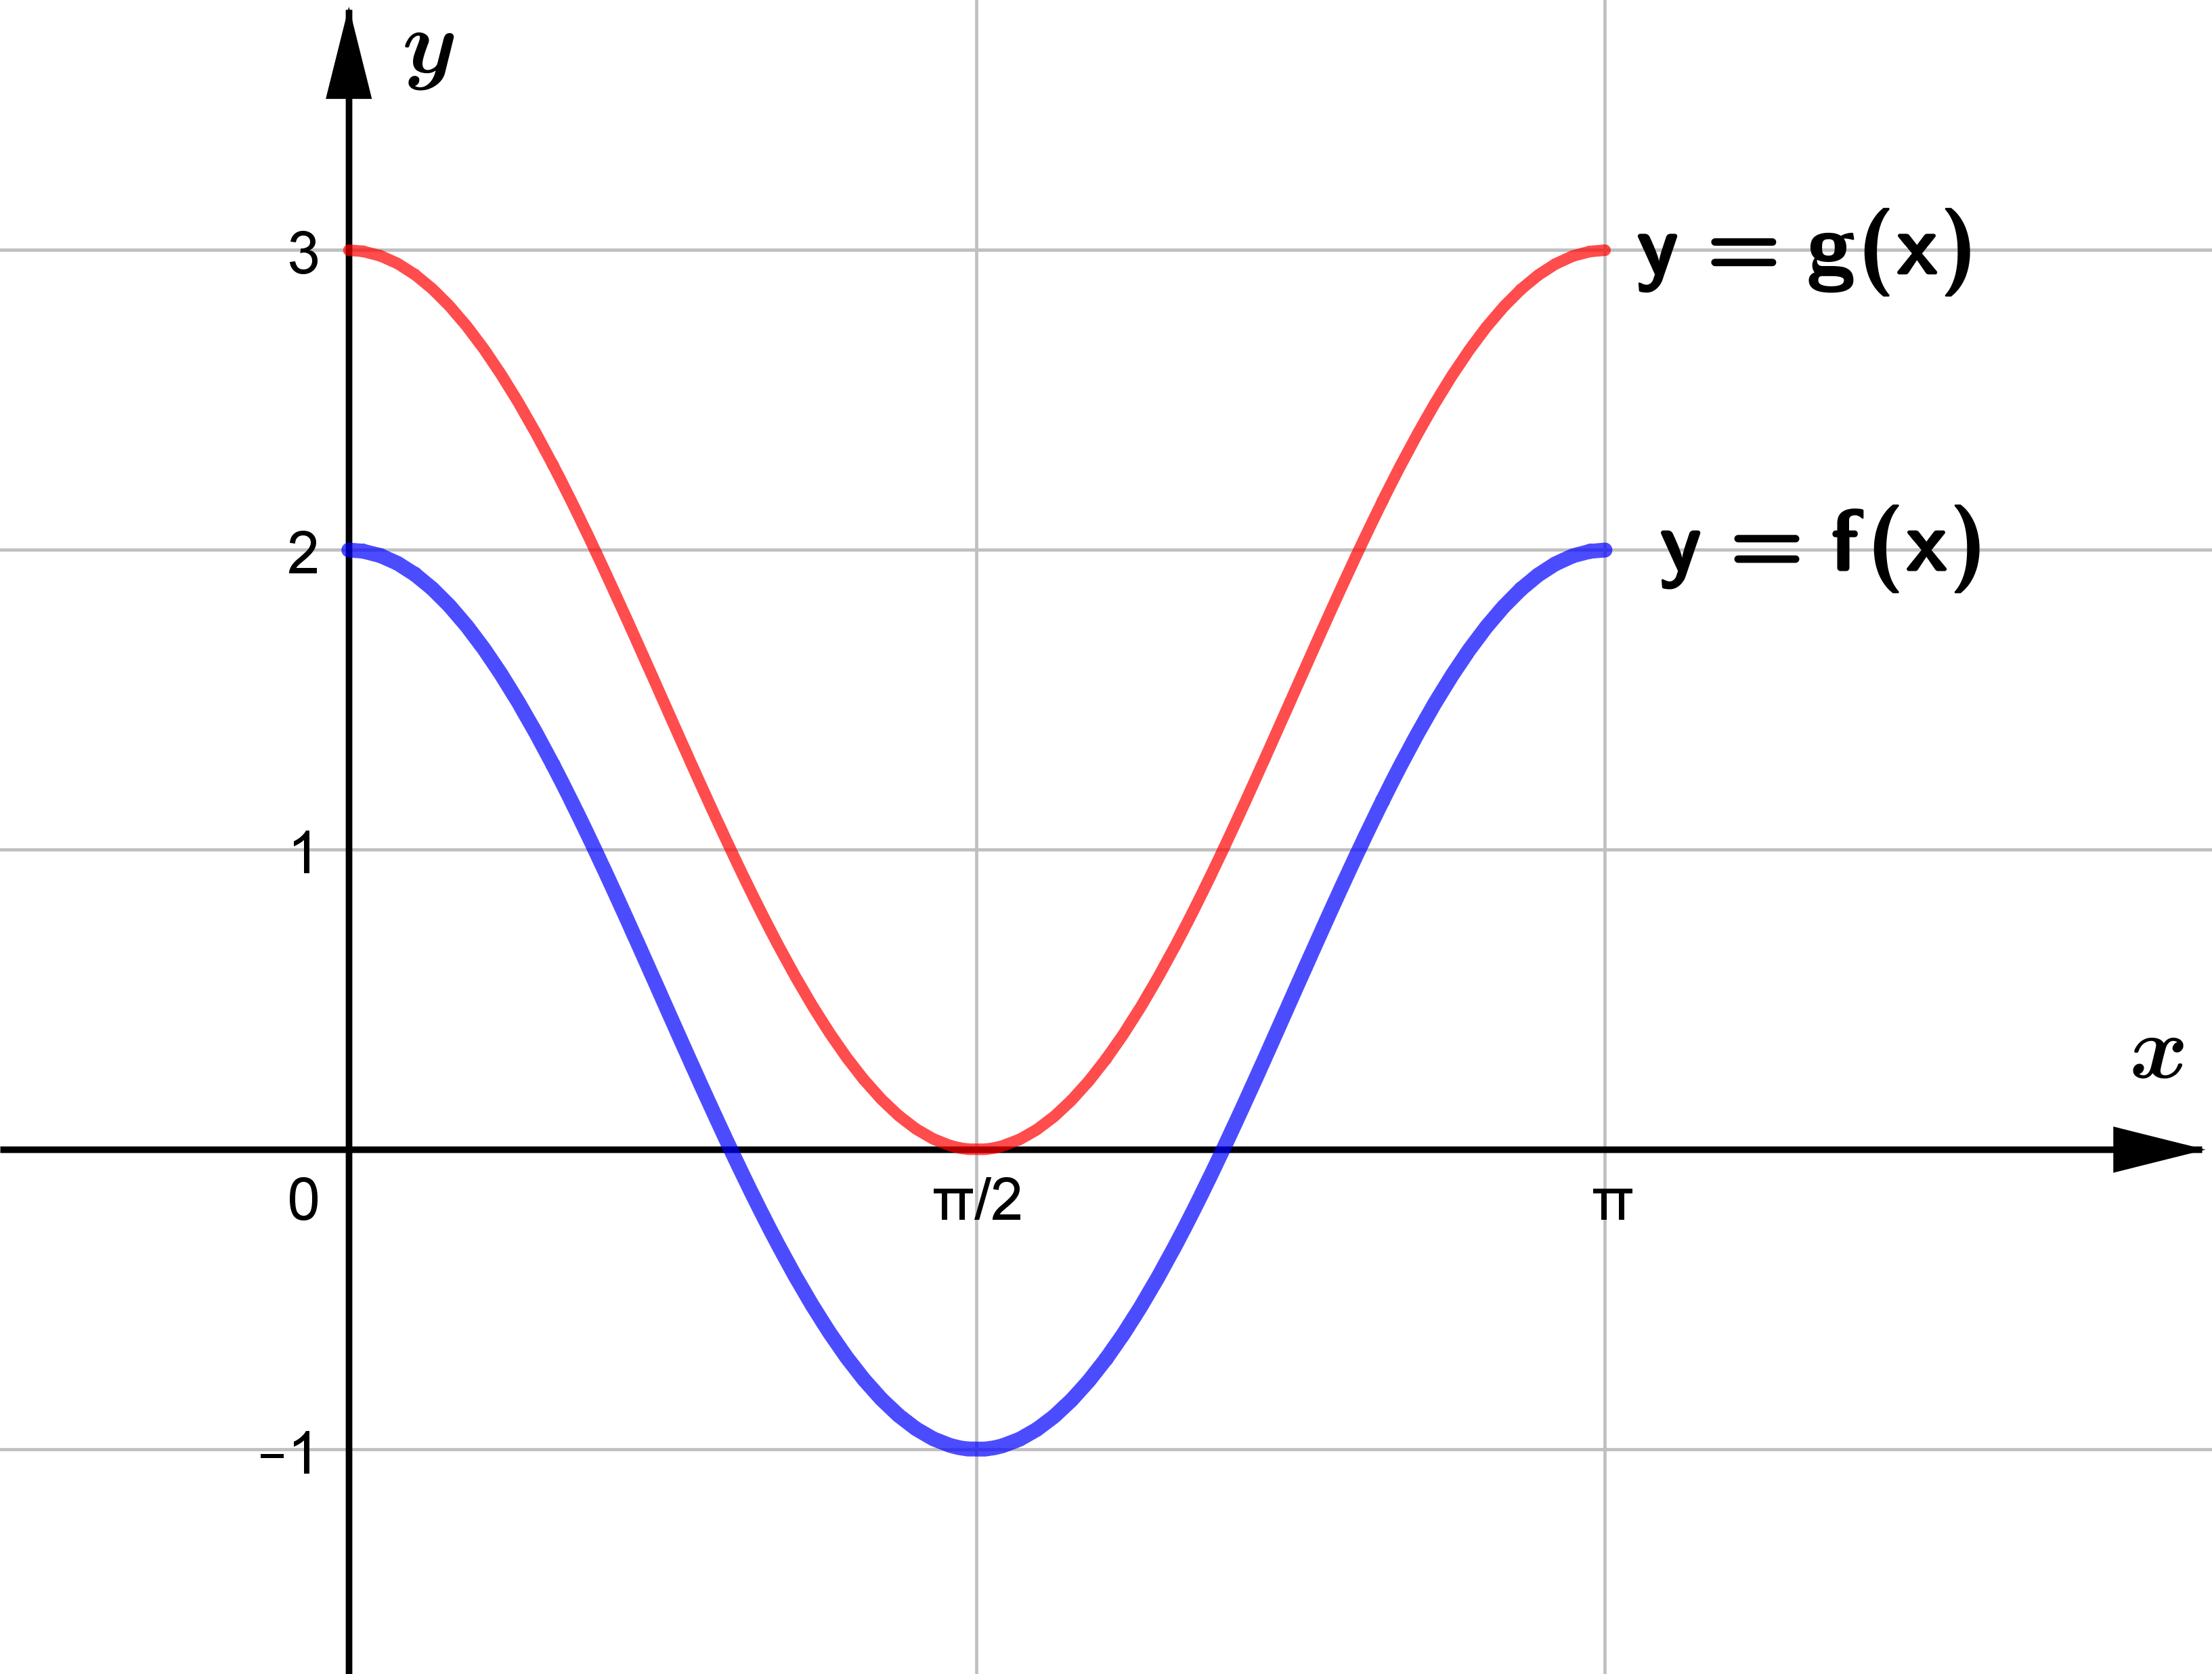
The diagram shows the graph of y=f(x), where f(x)=\displaystyle\frac{3}{2} \cos 2 x+\frac{1}{2}
for 0 \leqslant x \leqslant \pi.
(a) State the range of f.
A function g is such that g(x)=f(x)+k, where k is a positive constant.
The x-axis is a tangent to the curve y=g(x).
(b) State the value of k and hence describe fully the transformation that maps
the curve y=f(x) on to y=g(x).